Before Changes
Water Usage
Average Daily Water Usage (Household): 957 Litres
Usage from 8/10/2013 to 10/01/2014: 90 Kilolitres
Usage Per Person Per Day: 239 Litres
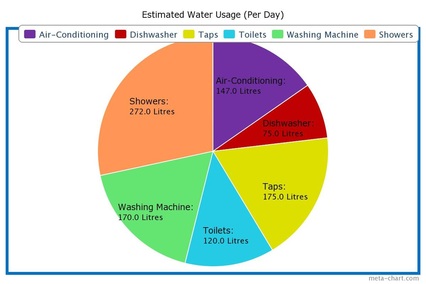
The pie chart above explains the various water appliances my household contains and the estimated average amount of water that is consumed through them every day. I have presented this in a pie graph as I believe it is an effective way to compare different appliances water consumption in my household.
Air-Conditioning: 147 Litres per day
Dishwasher: 75 Litres per day
Taps: 175 Litres per day
Toilets: 120 Litres per day
Washing Machine:170 Litres per day
Showers: 272 Litres per day
Average Daily Water Usage (Household): 957 Litres
Usage from 8/10/2013 to 10/01/2014: 90 Kilolitres
Usage Per Person Per Day: 239 Litres
The pie chart above explains the various water appliances my household contains and the estimated average amount of water that is consumed through them every day. I have presented this in a pie graph as I believe it is an effective way to compare different appliances water consumption in my household.
Air-Conditioning: 147 Litres per day
Dishwasher: 75 Litres per day
Taps: 175 Litres per day
Toilets: 120 Litres per day
Washing Machine:170 Litres per day
Showers: 272 Litres per day

The above image depicts my households average usage of water in litres per day. The bar graph compares this quarters usage and previous quarters water consumption. The graph shows that in this Quarter (January 2014), my households water consumption has increased lightly from previous Quarters.

Electricity Usage

The following image depicts my families approximate current average daily usage and annual electricity usage, compared with the average Victorian households daily and annual electricity usage. (please note these figures may differ from my january bill due to the program of which I gathered the values being inaccurate)
My household's average daily electricity consumption, measured in kilowatts is 17.87kWh. This amount compared to September 2013 shows a decrease in electricity consumption meaning my family has already made an effective change to our power consumption.
Also my families total greenhouse gas emission for this quarter are 2.32 tonnes of greenhouse gasses.

Gas Usage

Unfortunately, because my Dad changed our electricity and gas company right before I began this assignment I was unable to find a Gas bill for January or February that showed my households Gas consumption. As a result I have decided to use a gas bill from July 2013 to September 2013 instead.
This gas bill shows that my family has an approximate average daily usage of 1100 Mj (Megajoules) per day.
This can be roughly calculated from our overall natural gas consumption figure for the September quarter which is 65604.7 Mj. The figures shown display both of these values.
This gas bill shows that my family has an approximate average daily usage of 1100 Mj (Megajoules) per day.
This can be roughly calculated from our overall natural gas consumption figure for the September quarter which is 65604.7 Mj. The figures shown display both of these values.

After Changes
Water Usage
Average Daily Water Usage (Household): 936 Litres
Usage Per Person Per Day: 234 Litres
The pie chart above explains the various water appliances my household contains and the estimated average amount of water that is consumed through them every day while I had my changes in place. As you can see the compared to before my family started taking shorter showers, our water consumption has lowered slightly. Our household average daily water usage has lowered by 21 litres of water. I'm disappointed to see that our consumption of water has not lowered significantly however I am pleased that there has been some change. I have listed the water usage according to its source down below. As you can see the most significant differences in comparison to before my family enacted the sustainability changes is in our use of water when showering and using the air-conditioning. However the change in the air-conditioning can possibly be explained by the changes in the weather. As the weather is colder now than when my family started, we do not need to use the air-conditioning as often.
Air-Conditioning: 120 Litres per day
Dishwasher: 87 Litres per day
Taps: 179 Litres per day
Toilets: 122 Litres per day
Washing Machine: 174 Litres per day
Showers: 254 Litres per day


Show above are my measurements of waste that my household produced over my assignment period. My calculations depict a very slight change in all 3 categories. The smallest change was of our household production of paper waste. I believe this change is purely coincidental as my household made very little changes concerning our paper use, however this could be an area we may focus on in the future.
Another change I noticed was the change in consumption of plastic. Although it is only a minor 40grams less per, person per day I feel as though it is a good starting point. This change would possibly be because of my families weeks on the nude food diet as mentioned in my journal entry. The nude food diet successfully minimised the amount of packaged products my household purchases and ultimately the amount of plastic waste we produced.
The Biggest change in waste is in non-recyclable products with a difference of almost 250 grams per person, per day. I am unsure as to how this change occurred as my household made minimal changes to our non-recyclable waste. I think this change may be due to my brother and father going away on holidays for 3 weeks during this period. As they serve and consume the most food and other edible products, without them there is less left overs and less waste overall.
Electricity Usage
Unfortunately due to my families change in electricity company during my assignment period, I was unable to receive an electricity bill in time for this assignment to be submitted. I do believe I would have seen a significant change in my electricity bill however due to the changes in our household lights. During my semester my family made the change to energy saving light globes for almost every socket in our household. I expect this would have made a considerable difference to our electricity usage as my family uses lighting quite often.
Gas Usage

There has been significant changes in my family's gas usage over the period of september 2013 to may 2014. As you can seen there was a dramatic decrease in the amount of natural gas consumed in January 2014 as compared with September 2013. In fact January is but a tiny fraction on the value of September 2013. I believe this drastic decrease is due to two factors. Firstly we changed gas companies so are unable to receive a bill from October, November or December of 2013 thus making the contrast rather big between the months. Secondly, and most importantly, January is the beginning of summer and during summer it is far too warm to use gas heating which is what my family has in our home. Therefore the use of the heating is pretty much non-existent during the summer months. This also supports the increase in usage from January 2014 to May 2014. The weather begins to cool and so my household has to use our heating more frequently thus consuming more natural gas.

